One in eight Americans lives in a food desert. Is your service area one of them?
A food bank knows when demand is rising.
Staff see longer distribution lines. Volunteers pack more boxes. Families who once needed occasional help begin returning every month.
But grant applications often demand something more formal than lived experience: How many people in your service area have limited access to affordable, nutritious food?
The answer may already exist — buried inside a federal dataset that maps food access census tract by census tract.
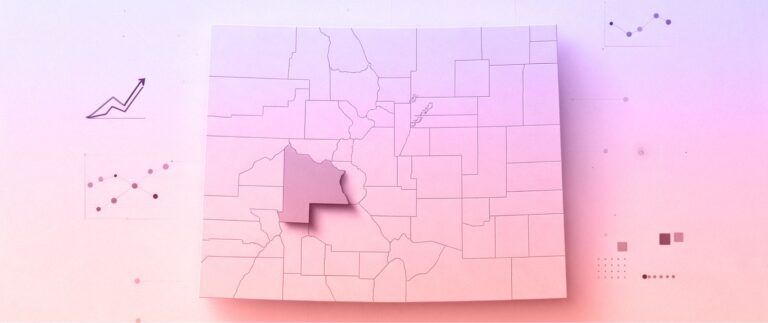
Nationally, approximately 12.7% of people live in low-income, low-access areas commonly called food deserts. In El Paso County, Colorado, the share is higher: 16.7%.
That means roughly one in six county residents lives in a community where income and distance can make reaching a full-service grocery store more difficult.
What Dorothy found
When asked about food access in El Paso County, Dorothy located the county’s low-income, low-access population through the Data Love Hunger Dashboard and traced the measure to the U.S. Department of Agriculture’s Food Access Research Atlas.
The comparison provides immediate context:
- United States: 12.7%
- El Paso County, Colorado: 16.7%
- Difference: 4 percentage points
- Relative difference: El Paso County’s rate is about 31% higher than the national rate
For a grant writer, that comparison can turn a broad statement — “many residents struggle to reach healthy food” — into a measurable case for investment.
But the percentage needs an explanation. A food desert is not simply a neighborhood without a supermarket, and the designation does not measure every obstacle that can prevent a family from eating well.
What “food desert” actually means
The USDA generally uses the more precise term low-income, low-access census tract.
Under one of the agency’s standard measures, a tract must first meet federal low-income criteria. It must then have at least 500 residents or 33% of its population living more than:
- One mile from a supermarket, super center or large grocery store in an urban area
- 10 miles from one in a rural area
The Atlas also provides alternative distance measures, including one-half mile for urban communities and 20 miles for rural communities. USDA now offers measures based on both straight-line and road-network distances.
This means there is no single universal food-desert percentage unless the researcher identifies which measure was used.
A strong grant narrative should therefore do more than report that 16.7% of El Paso County residents live in a food desert. It should identify the underlying measure and source so reviewers can understand what the figure represents.
What the designation tells us
The low-income, low-access designation captures the intersection of two important barriers.
Households have limited financial resources. A tract can qualify as low income when its poverty rate is at least 20% or when its median family income falls below specified state or metropolitan thresholds.
A substantial part of the population lives far from a major food retailer. Distance becomes especially important for households without reliable transportation, older adults, people with disabilities and workers whose schedules do not align with store or transit hours.
The USDA Atlas also allows researchers to examine measures involving vehicle access, SNAP participation, children, older adults, race, ethnicity and other populations.
For food banks and community organizations, those tract-level details can help answer more focused questions:
- Which neighborhoods face overlapping income and transportation barriers?
- Where could a mobile pantry reach the most residents?
- Which distribution sites are closest to high-need census tracts?
- Where might evening, weekend or home-delivery services close an access gap?
- Which populations may require more targeted outreach?
The designation does not prescribe the solution. It helps organizations see where solutions may be needed most.
USDA Food Access Research Atlas · low-income, low-access tracts
What the food desert measure captures — and what it leaves out
Share of residents in low-income, low-access tracts
4 percentage points higher — a rate about 31% above the national figure. Roughly one in six county residents.
There is no single universal food-desert percentage. The figure depends on which USDA distance measure is used, so a grant narrative should name the measure and the source.
What it measures
- Tract poverty rate of 20% or more, or median family income below the state or metro threshold
- 500 residents, or 33% of the tract, living more than 1 mile from a supermarket in an urban area
- Or more than 10 miles from one in a rural area
What it misses
- Limited transit; households sharing one vehicle
- Gas and transportation costs; high local food prices
- Disability and mobility limitations
- Store hours, seasonal road closures, child care
- Whether food meets cultural or medical needs
- Incomes above the threshold but below the cost of living
A map identifies where a barrier may exist. Residents and providers explain how it works in daily life.
The Data Love Co.What the map misses
A census tract can sit close to a supermarket and still have serious food-access problems.
Distance does not tell us whether residents can afford what the store sells. It does not measure whether fresh produce is consistently available, whether food meets cultural or medical needs or whether shoppers feel safe traveling to the store.
The designation may also miss:
- Limited public transportation
- Households sharing one vehicle
- Gas and transportation costs
- Physical disabilities or mobility limitations
- Seasonal road closures or severe weather
- Stores with limited hours
- High local food prices
- Lack of child care
- Digital barriers to ordering groceries
- The capacity and operating hours of food pantries
- Families whose income is above the threshold but still insufficient to cover food, housing and health-care costs
The Atlas identifies geographic and economic barriers to large food retailers. It does not directly measure hunger, food quality or household food insecurity.
Those concepts are related, but they are not interchangeable.
A family can live outside a designated food desert and still skip meals. Another can live in a low-access tract but maintain reliable food access through transportation, delivery services or community support.
That is why the USDA designation should be treated as one layer of evidence — not the entire needs assessment.
How food banks can use the data
For food banks, a food-access measure can support both planning and fundraising.
A grant narrative might read:
Approximately 16.7% of El Paso County residents live in census tracts classified as low income and low access to a supermarket or large grocery store, compared with 12.7% nationally. The USDA designation identifies communities facing overlapping economic and geographic barriers to food access. Local distribution data further show how those structural barriers translate into demand for emergency and supplemental food assistance.
The first two sentences establish the external benchmark. The third creates space for the organization’s own evidence.
That local evidence could include:
- Households served
- Repeat visits
- Pounds of food distributed
- Mobile pantry participation
- Requests for delivery
- ZIP codes or census tracts served
- Transportation barriers reported by clients
- Changes in demand over time
- Distance traveled to reach a distribution site
Together, the federal and local data tell a stronger story than either could tell alone.
The USDA measure establishes that structural barriers exist. Program data show how those barriers affect real people and how the organization is responding.
How funders can use it
Funders can use low-income, low-access data to compare communities, identify geographic gaps and evaluate whether proposed services are positioned near populations experiencing documented barriers.
The measure can help support investments in:
- Mobile markets and pantries
- Community food distribution
- Transportation assistance
- Grocery delivery
- Cold-storage capacity
- Community gardens
- Nutrition programs
- Retail food development
- Services designed for older adults, children or people with disabilities
But responsible funding decisions require more than drawing a boundary around a qualifying census tract.
Tract-level data should be combined with current community input, organizational service records and other indicators such as poverty, food insecurity, SNAP participation and transportation access. A map can identify where a barrier may exist. Residents and service providers explain how that barrier functions in daily life.
The Data Love perspective
Food-access data is most powerful when it connects geography with human experience.
A percentage such as 16.7% can show that El Paso County faces a greater low-income, low-access burden than the nation overall. It can strengthen a funding request, guide outreach and help an organization decide where to place its next mobile distribution site.
But the designation should never become a substitute for listening to the people represented on the map.
Dorothy helps organizations move between those two levels: from a national dataset to a local census tract, and from a tract-level statistic to the questions that still need to be asked.
Because knowing where a food desert is located matters.
Understanding what people living there actually need matters even more.
Ask Dorothy: What share of people in your county live in a food desert?
Explore more data-informed grant strategies from Data Love Co. and see how Dorothy helps translate complex public datasets into clear, credible evidence for community investment.